
The oscilloscope is a very powerful tool that has many functions. A very interesting one, at least for educational purposes, is the measurement of complex loads: R, X, VSWR, Return Loss, Phase, capacitance, inductance and real power.
The measurement method
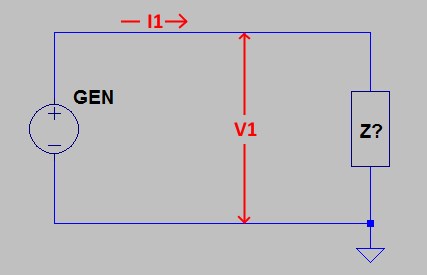
The measurement of an unknown load, and the power that is being delivered to it, is conceptually very simple thanks to the Ohm’s law:
Z? = V1 / I1
Power at Z? = V1 * I1
The only difference between these measurements and those made at DC is that here all involved values are complex numbers. Beside the magnitude of V1 and I1, we need also to know φ, i.e. the phase difference between voltage and current.
As we know, an oscilloscope can measure voltage, but how can it measure current? The answer is very simple, use one of these configurations:
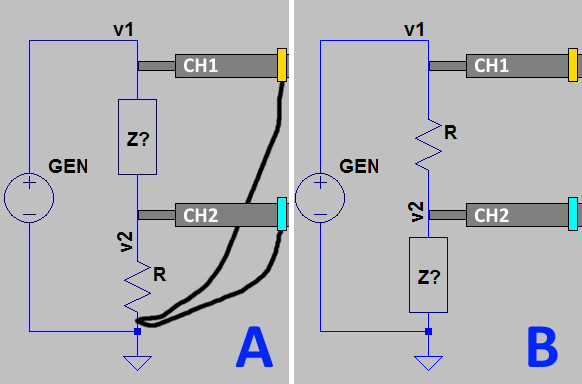
We measure V1 by simply connecting the CH1 probe across the load. Instead we measure I1 by adding a known resistor R in series with Z and measuring the voltage drop across it with the CH2 probe. This measurement gives us the current I along the entire circuit (I = V2/R). Thus, the phase difference between CH1 and CH2 gives the φ between voltage and current.
Measurement example #1
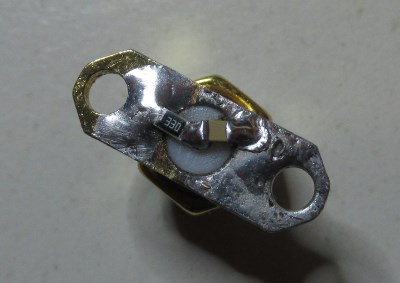
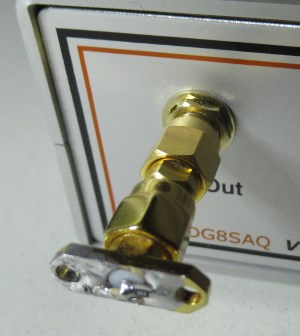
To easen the measurements I prepared a simple fixture made of two SMA female panel connectors soldered back to back. The central pins are soldered together, while the ground flanges are connected by mean of a 12Ω resistor, which is my known “R”.
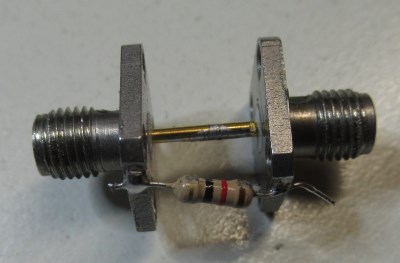
Form my example #1, I prepared a SMA male connector with soldered a 33Ω SMD resistor in parallel with a 330pF SMD capacitor. This test load will later allow me accurate and repeatable measurements on a Vector Network Analyzer for comparison.
I can proceed now to connect my oscilloscope:
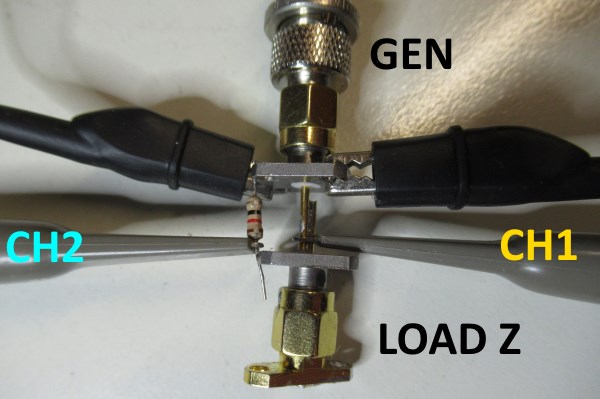
The channel 1 probe (yellow on my scope) is connected to the central pin and to the ground on the generator side.
The channel 2 probe (cyan on my scope) is connected to the 12Ω “R” resistor towards the load. Its ground clip is connected to the ground on the generator side together with the ground of channel 1.
The oscilloscope probes must be set to 10X to reduce their parasitic capacitance, thus reducing the measurement error.
The generator in my case is lab RF signal generator set to 13dBm output at 10 MHz, but any sine wave generator can be used. For example, it can be a regular ham RTX, maybe with an attenuator to reduce the mismatch seen by the transceiver.
This is what I see on my scope with this setup:
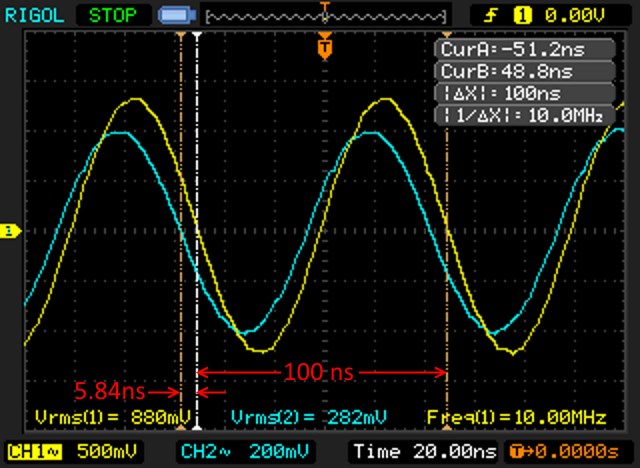
The values needed to perform the calculations are:
- V1=0.880Vrms, in my setup, the yellow trace;
- V2=0.282Vrms, in my setup, the cyan trace;
- WL=100ns, i.e. the wavelength; this value is taken by measuring the length of a full wave;
- PD=-5.84ns: this the horizontal shift of the two curves;
Note that the “PD” (Phase Difference) value is negative: by convention of the online calculator we will use, we have that:
- the value must be given as negative if we are measuring the distance from the yellow trace (CH1) to the cyan trace (CH2) going leftwards, like in this example;
- the value must be given as positive if we are going to measure rightwards;
- the measurement unit of WL and PD does not matter as long as it is the same; you can measure the distances on the screen with a ruler and enter the data as mm or inches.
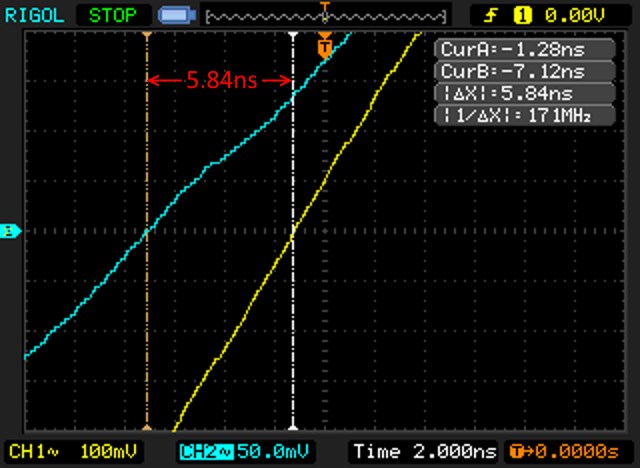
To measure the phase difference with the best precision, it is useful to zoom in the trace by increasing the horizontal scale:
At this point we are ready for the calculations. Instead of going through al the complex number calculations, I developed a dedicated online calculator which I will use for this test. This is the input data:
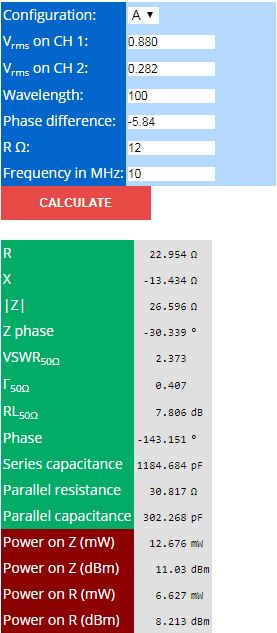
The calculator reports the usual information normally available from VNAs: R, X, Return Loss, etc. Note that, unlinke many cheap antenna analyzers, this measurement method is able to correctly detect the reactance sign.
We shall now compare these results with those obtained by other instruments.
VNA analysis
In order to verify these results, I measured the same load using a calibrated Vector Network Analyzer, so we can compare them with a more accurate measurement.
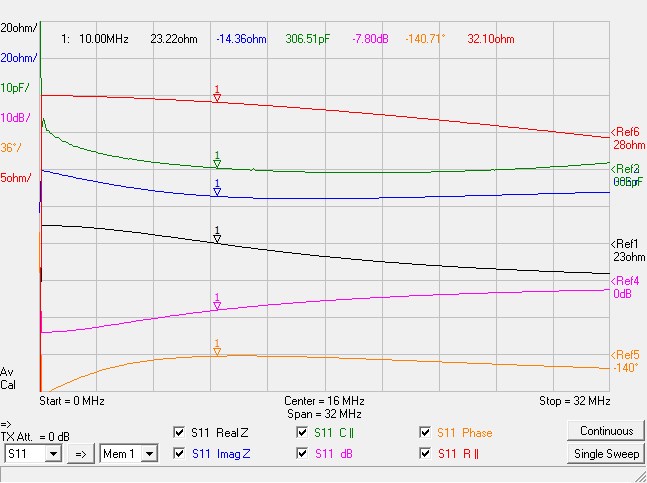
This is the result:
Let’s compare the results:
| Label | Scope | VNA | Error |
|---|---|---|---|
| R | 22.954Ω | 23.224Ω | 1.17% |
| X | -13.434Ω | -14.356Ω | 6.64% |
| RL | -6.247dB | -7.804dB | 1.56dB |
| Phase | -143.151° | -140.7° | 2.45° |
| Par.R | 30.817Ω | 32.098Ω | 4.08% |
| Par.C | 302.268pF | 306.504pF | 1.39% |
As we can see, the impedance measurement made by the oscilloscope looks quite accurate.
Power measurement
As we have seen, besides of the load impedance, this method measures also the real power delivered to the load.
From the previous chapter, we already know the impedance of the load as measured by the VNA: R=23.224 X=-14.356. This impedance is the equivalent of a 32.098Ω resistor in parallel with a 306.504pF capacitor.
The impdedance of the fixture with the 12Ω resistor reads R=12.018 X=1.021, which is the equivalent of a 12.018Ω resistor in series with a tiny 16nH inductor.
We can now measure the RMS voltage using a Rohde & Schwarz RF millivoltmeter:
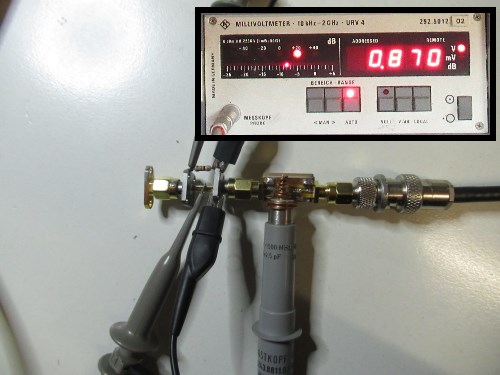
We can now create a SPICE circuit with a 10MHz generator providing 0.870Vrms (as read by the millivoltmenter) on the discrete components calculated by the VNA. This is the SPICE circuit with the RMS power levels calculated by it:
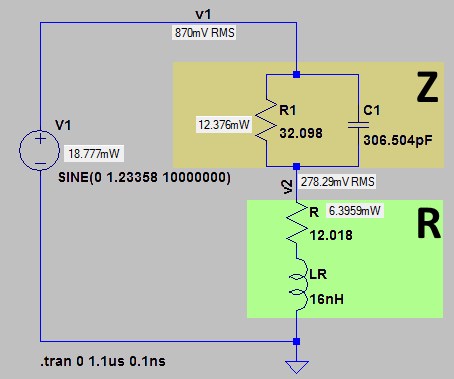
These are the power values calculated by SPICE compared to those calculated by the online calculator from the oscilloscope data:
| Label | Scope | SPICE | Difference |
|---|---|---|---|
| Power on Z | 12.676mW (11.03dBm) | 12.376mW (10.93dBm) | 0.10db |
| Power on R | 6.627mW (8.21dBm) | 6.3959mW (8.06dBm) | 0.15db |
| Overall power | 19.303mW (12.86dBm) | 18.777mW (12.74dBm) | 0.12db |
The power measurements, with a difference of only 0.10/0.15dB with the VNA+RF millivoltmeter method, appear to be quite accurate.
Measurement example #2
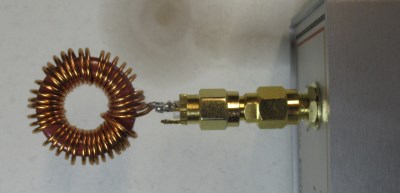
In this example, we shall measure an inductor made of 36 turns of AWG#20 wire on an Amidon T80-2 toroid at 5 MHz. I have chosen this configuration because it is one of the examples documented by Amidon:
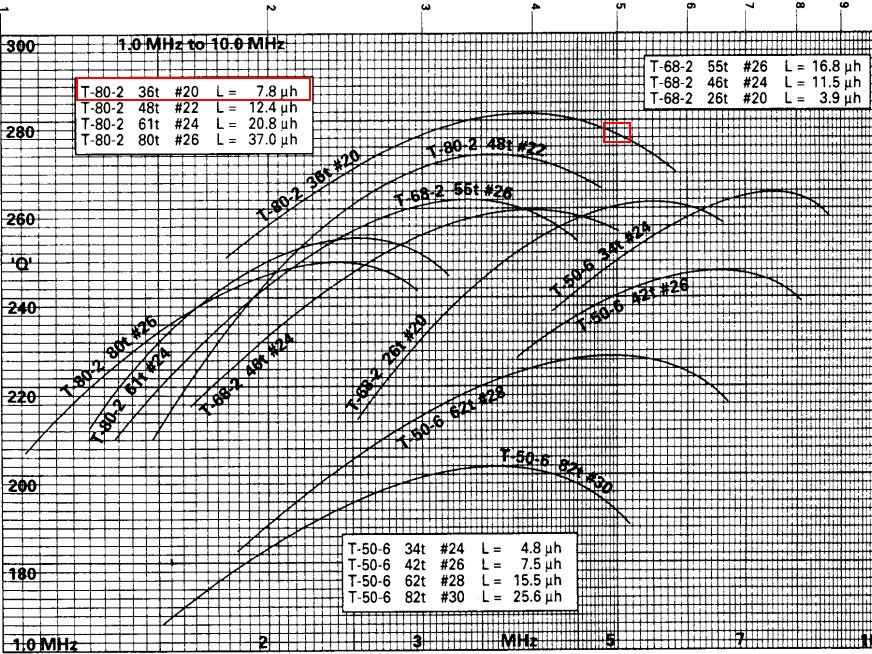
From Amidon tables we see that its inductance should be 7.8μH.
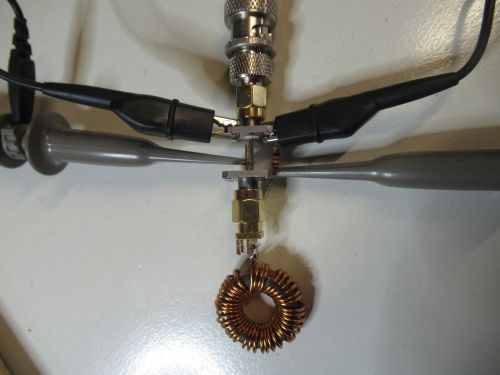
We can now prepare the fixture and take our measurement:
The oscilloscope gives us this reading:
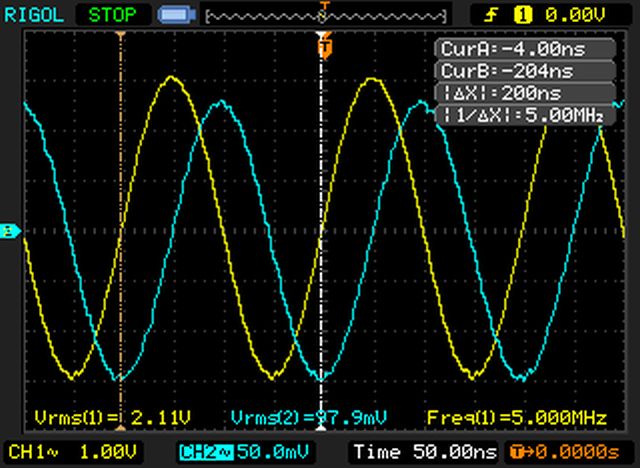
To have a better reading of the phase difference, once again I have zoomed the oscilloscope reading:

Unlike the example #1, this time the blue trace is shifted to the right, showing that the load is inductive instead of capacitive. According once again to the convention, since we are measuring starting from CH1 and going rightwards, the phase difference (45.6ns) must be positive.
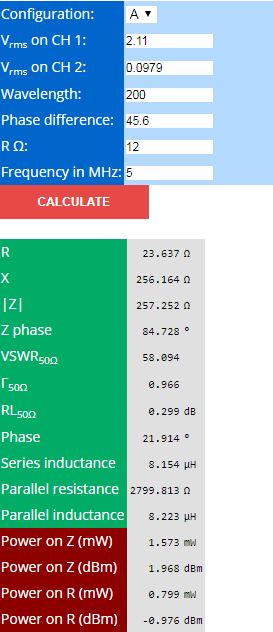
We have now all the data we need and we can feed the online calculator:
Results validation
Let us as usual take the measurement of the same inductor with a calibrated VNA to compare the results:
The result of the VNA is the following:

The VNA measures an inductance of 7.8314μH, which matches Amidon’s declared 7.8μH. The the scope reports a little bit higher 8.154μH (4% difference).
To be fair I have to say that to obtain this measurement, the VNA reference plane has been moved at the inductor plane, thus cancelling the impedance transformations due to the fixture. This function is quite advanced and it is not available on most cheap VNA/Antenna Analyzers. If I repeat the measurement without this correction, as most of the cheap VNAs do, I obtain this:
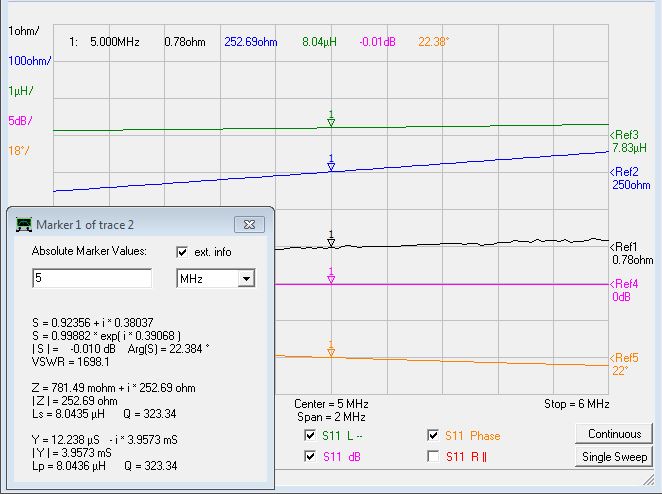
The series inductance now “appears” as 8.0435μH, which is very close to the 8.154μH measured by the scope (+1.3%).
Conclusions
- With a simple fixture, a two channels oscilloscope can be used to measure voltage, current and phase difference among them (φ).
- A RF source is required to do the measurements: it can be a signal generator, a normal transceiver or anything else able to generate enough power for the scope to measure the voltage.
- With the data above, the Ohm’s law and some complex numbers calculation we can derive all the data normally produced by vector network analayzers (R, X, RL, phase, VSWR, capacitance, inductance, etc.).
- With the same data, the real power delivered on the load under test can be calculated thus making the oscilloscope act as a power meter.
- Unlike common power meters, that can measure power on a given load (for example, 50Ω), this method allows the measurement of power actually dissipated by load of any impedance.
- The stray capacitance of the probes and the low precision in voltage measurement ad high frequencies limit the maximum frequency at which this method gives reliable results; with a common 50-100MHz oscilloscope, probably the safe limit is around 30 MHz.

Nice article.
Would it be possible to send the formulas used by your calculator?
Thank you.
If it’s possilble , pleas send me too,
good work!
thanks adam
excellent..! tnx.
de SV1COX
Good documentation, but I´m missing the equation of the calculator.
Would it be possible to send the formulae? Thank you for your good work. Greeting from Salzburg in Austria.
Siegfried Georg Burger
Hello, This is excellent. I was wondering though on the output side:
is X the same as Xc (capacitive reactance),
is R the same as ESR,
and what is Qz (part of the output of the calculator but not this example).
Measurement example #1 shows a table to compare the VNA and O-Scope measurements.
I see that the RL of the O-Scope is -6.247dB and the VNA is -7.804dB.
Yet I cannot find where you got -6.247dB, did I overlook something. I see the calculation on the website that you used shows 7.806dB in RL
Did you do some other calculations to get -6.247dB that I overlooked?
Hi, Thank you, can you share the equations which you used to calculate values?
You can find the equations at this link:
https://www.iz2uuf.net/wp/index.php/oscilloscope-to-impedance-calculator/